Standard Deviation in Mutual Funds: Volatility Meaning & How to Use It
By Amrita Sinha
About the Author
Amrita Sinha is a content strategist with experience in SEO, digital marketing, and financial content. She writes easy-to-understand, research-backed articles on investing, personal finance, taxation, and wealth management for Kuberzo.
Understand standard deviation in mutual funds, how it measures volatility, what 15% standard deviation means, and how to use it to compare funds.
When choosing a mutual fund, looking at returns alone can be misleading. A fund that delivers 15% annual returns may experience relatively stable performance, while another fund with similar returns may see much sharper ups and downs.
So, how can you understand these fluctuations before investing?
One useful measure is standard deviation. It helps investors understand how much a mutual fund's returns have varied around their average over a particular period.
Understanding standard deviation in mutual funds can help you evaluate volatility, compare funds within the same category and decide whether a fund's historical behaviour suits your risk tolerance.
However, a higher standard deviation does not automatically mean a fund is poor, and a lower figure does not guarantee safety. The metric works best when considered alongside returns, investment objectives and other risk measures.
In this guide, we explain what standard deviation means, how to interpret it and how to use it when comparing mutual funds.
Before investing, assess your investment risk profile to understand whether a fund's historical volatility fits your comfort with market fluctuations.
What Is Standard Deviation in Finance?
To understand what standard deviation is in finance, think of it as a measure of how widely a set of values varies around its average.
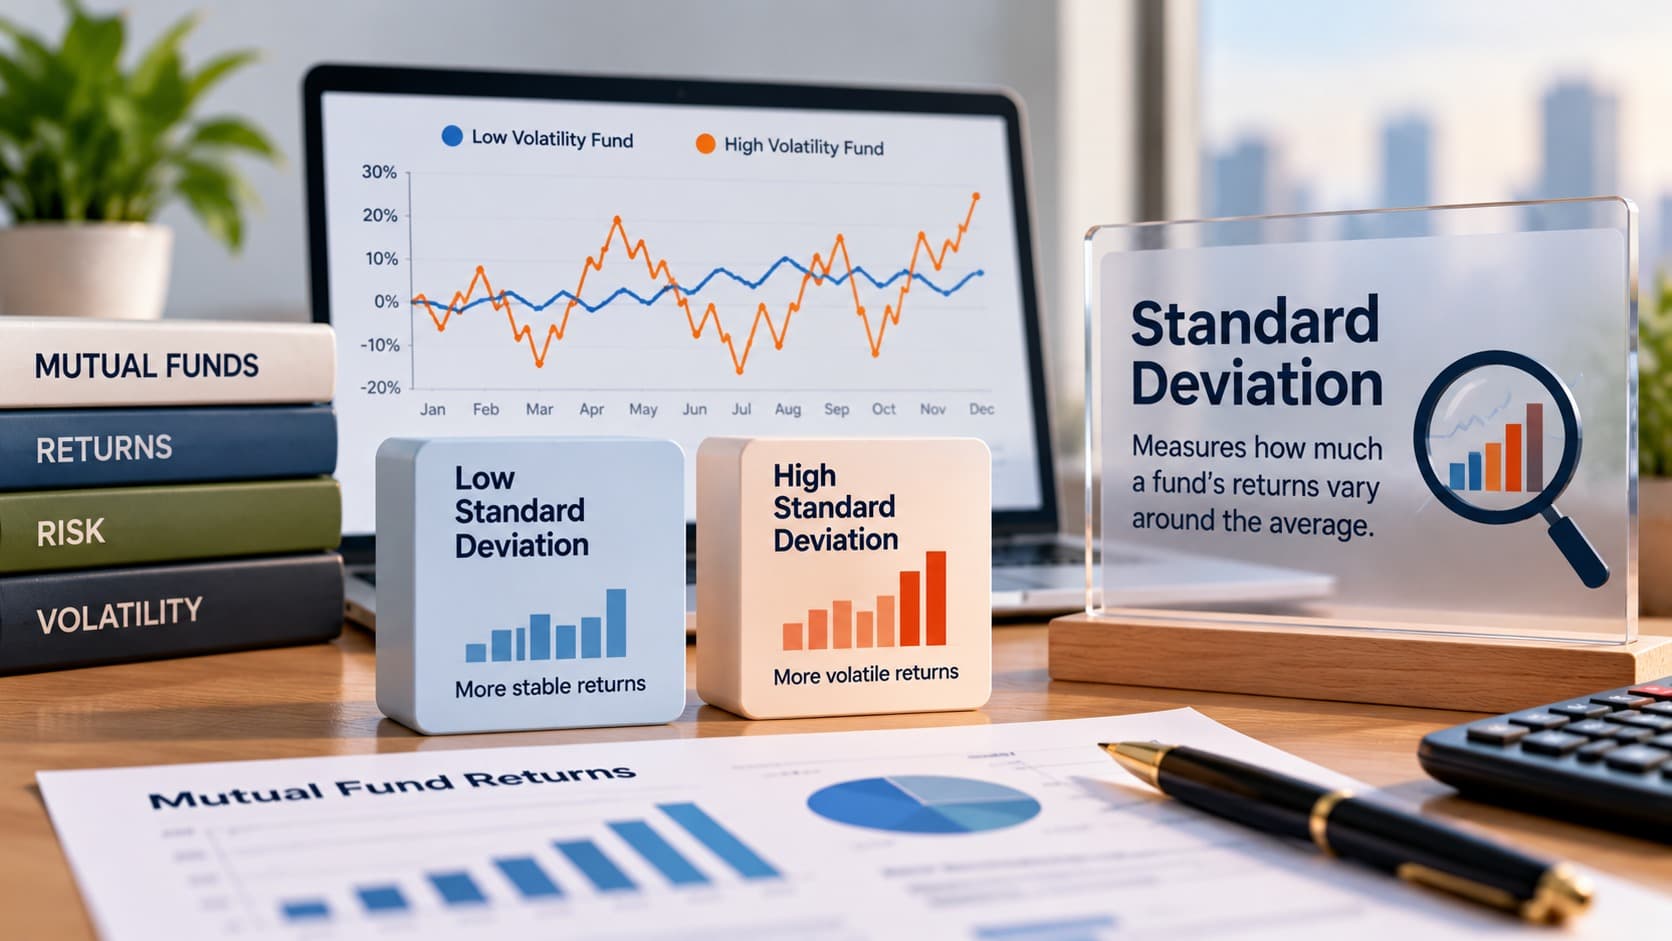
In mutual fund investing, standard deviation measures the historical dispersion of a fund's returns. A low value generally indicates that returns have fluctuated less around their average, while a high value indicates greater fluctuations.
For example, imagine two funds that have delivered similar average returns over the same period.
Fund A has a standard deviation of 5%.
Fund B has a standard deviation of 12%.
Fund B has experienced greater variability in its returns during the period measured. Fund A's returns have been relatively less spread out around their average.
This does not mean Fund A will necessarily deliver better future returns. It simply tells you that the historical pattern of its returns was less volatile according to this measure.
Mutual Fund Volatility Meaning: Why Does It Matter?
The mutual fund volatility meaning refers to how much a fund's returns fluctuate over time. Volatility is a normal part of investing, particularly in equity markets, where prices respond to economic conditions, corporate earnings, interest rates and investor sentiment.
Standard deviation helps quantify these fluctuations rather than relying only on the impression that a fund seems risky.
It can be useful when:
Comparing the historical volatility of similar mutual funds.
Understanding how consistently a fund's returns have behaved.
Evaluating whether a fund's fluctuations may be uncomfortable for you.
Complementing other measures of investment risk.
Reviewing how a fund's volatility has changed across different periods.
Remember that standard deviation is backwards-looking. It describes historical return variability, not the exact level of risk a fund will experience in the future.
How Is Standard Deviation Calculated?
Standard deviation is calculated by measuring how far individual returns vary from their average return.
The general process involves:
Calculating the average return over the selected period.
Measuring the difference between each return and the average.
Squaring those differences.
Calculating their average, according to the chosen statistical method.
Taking the square root of the result.
In mutual fund analysis, providers may use periodic returns, such as daily or monthly observations, and may annualise the resulting standard deviation. The exact method can affect the reported number.
For example, if a fund's monthly returns fluctuate considerably around their average, its standard deviation will generally be higher than that of a fund whose monthly returns stay closer to their average.
When comparing two funds, make sure their standard deviation figures use comparable periods, return frequencies and annualisation methods.
High vs Low Standard Deviation: What Is Better?
The high vs low standard deviation comparison helps investors understand the difference in historical volatility between funds.
Feature | Low Standard Deviation | High Standard Deviation |
Return fluctuations | Historically smaller | Historically larger |
Return pattern | More closely clustered around the average | More widely spread around the average |
Investor experience | May involve less variation in returns | May involve more noticeable ups and downs |
What it tells you | Lower historical volatility | Higher historical volatility |
Does it guarantee better returns? | No | No |
A fund with low standard deviation may suit investors who prefer relatively stable return patterns, depending on the fund's category and investment objective. A fund with high standard deviation may experience greater fluctuations, which some long-term investors may be willing to accept in pursuit of their goals.
However, standard deviation does not distinguish between positive and negative fluctuations. A fund can have high volatility because of strong upward movements as well as sharp declines.
Therefore, do not choose a fund based on this number alone. Evaluate its returns, downside risk, portfolio and suitability for your investment horizon.
What Does 15% Standard Deviation in Funds Mean?
The meaning of 15% standard deviation in funds depends on the period, methodology and return distribution used to calculate it.
Suppose a mutual fund has an annualised average return of 12% and an annualised standard deviation of 15%. This means its historical returns have shown a level of variability corresponding to a standard deviation of 15 percentage points on an annualised basis, under the calculation method used.
It does not mean that the fund will return between −3% and 27% every year. Nor does it mean the fund will lose 15% or that its returns are guaranteed to stay within a fixed range.
If returns followed a normal distribution, a mean of 12% and a standard deviation of 15 percentage points would place approximately 68% of observations within one standard deviation of the mean. But financial returns do not always follow a normal distribution, and annualised statistics should not be interpreted as precise forecasts.
The practical takeaway is to compare the figure with funds in the same category, using consistent data and time periods. A 15% standard deviation may mean something different for a small-cap equity fund than for a short-duration debt fund.
Standard Deviation vs Beta in Mutual Funds
Standard deviation and beta are both used to assess investment risk, but they measure different things.
Understanding the standard deviation vs beta in mutual funds comparison can help you interpret risk more accurately.
Feature | Standard Deviation | Beta |
Measures | Total variability in a fund's returns | Sensitivity to movements in a benchmark |
Risk focus | Fund-specific and market-related fluctuations | Relative movement against the benchmark |
Reference benchmark required? | No benchmark is required for the basic calculation | Yes, beta is measured against a benchmark |
Higher value indicates | Greater historical return variability | Greater sensitivity to benchmark movements |
Main limitation | Does not separate upside and downside fluctuations | Does not capture every aspect of total risk |
A mutual fund portfolio review can help you examine volatility alongside portfolio concentration, sector exposure and other investment risks.
For example, a fund may have a high standard deviation because its returns fluctuate substantially. Its beta may be relatively low if those movements are not closely related to its benchmark.
Conversely, a fund with a high beta tends to be more sensitive to benchmark movements, although its total volatility also depends on other factors.
Both metrics can provide useful information, but neither should be interpreted in isolation.
How to Measure Mutual Fund Risk Using Standard Deviation
If you are wondering how to measure mutual fund risk, standard deviation can be a useful starting point. Here is how to apply it when comparing schemes.
1. Compare Funds Within the Same Category
Start by comparing funds with similar investment objectives. Comparing the standard deviation of a small-cap equity fund directly with that of a liquid fund may not provide a meaningful assessment because their underlying investments and risk profiles are very different.
2. Use the Same Time Period
Compare three-year figures with three-year figures, or five-year figures with five-year figures, where comparable data is available. A fund's volatility may change significantly depending on the market conditions during the period selected.
3. Look at Returns Alongside Volatility
A low standard deviation is not enough if a fund has also delivered weak returns. Similarly, a fund with higher volatility may have generated stronger returns, although this does not guarantee that it will continue to do so.
Consider whether the historical returns justify the level of variability, and review other risk-adjusted measures where appropriate.
4. Check Downside Risk and Portfolio Composition
Standard deviation treats upward and downward fluctuations as part of total variability. To understand potential losses more directly, examine measures such as maximum drawdown and downside risk. Also review portfolio concentration, sector exposure and the liquidity of the underlying investments.
5. Match the Fund to Your Risk Tolerance
A fund's historical volatility should be considered alongside your investment horizon and financial needs. If you may need the money soon, sharp fluctuations could create difficulties even if the fund has performed well over a longer period.
Are Low Standard Deviation Equity Funds Better?
Investors often search for low standard deviation equity funds because they want exposure to equities without excessive fluctuations.
Such funds may have experienced lower historical volatility than comparable schemes. However, lower standard deviation does not automatically mean lower risk in every sense.
For example, a fund may have relatively stable returns during a period of rising markets but still face losses when market conditions change. Its portfolio may also be concentrated in particular sectors or companies, creating risks that standard deviation alone cannot fully explain.
When evaluating these funds, consider:
Historical returns over multiple periods.
Standard deviation compared with similar equity funds.
Portfolio diversification and sector exposure.
Downside performance during market corrections.
Investment strategy and expense ratio.
Your investment horizon and financial goals.
A lower standard deviation can be useful information, but it should not be the sole reason for selecting a mutual fund.
Common Mistakes When Interpreting Standard Deviation
Investors should avoid a few common mistakes:
Assuming high standard deviation always means poor performance.
Treating low standard deviation as a guarantee against losses.
Comparing funds from unrelated categories without considering their investment objectives.
Ignoring the period and methodology used to calculate the figure.
Assuming historical volatility predicts future volatility precisely.
Using standard deviation without reviewing returns and other risk measures.
A balanced evaluation is more useful than relying on a single statistic.
Conclusion
Standard deviation in mutual funds helps investors understand how much a fund's returns have historically fluctuated around their average. It can make comparisons more structured and help investors assess whether a fund's return pattern suits their comfort with market movements.
However, standard deviation is only one part of risk analysis. It does not guarantee future stability, predict losses with certainty or tell you whether a fund is suitable for your goals.
Compare funds within the same category, use consistent periods, review returns alongside volatility and examine other risk measures before investing.
Ultimately, the goal is not simply to find a fund with the lowest standard deviation. It is to choose investments whose risks, potential returns and time horizon align with your financial objectives.
A goal-based financial planner can help you align your investment choices with your financial goals, time horizon and tolerance for risk.
Frequently Asked Questions
What is standard deviation in mutual funds?
Standard deviation measures how widely a mutual fund's historical returns have fluctuated around their average. A higher figure generally indicates greater historical volatility.
Is high standard deviation good or bad?
Neither automatically. High standard deviation indicates greater variability in returns. Whether that is appropriate depends on the fund's category, investment strategy, your time horizon and your ability to tolerate fluctuations.
What does 15% standard deviation mean in a mutual fund?
It indicates a particular level of return variability under the calculation method used. If the figure is annualised, it represents annualised volatility, not a guaranteed range of returns or a prediction of a 15% loss.
What is the difference between standard deviation and beta?
Standard deviation measures total variability in a fund's returns. Beta measures how sensitive the fund's returns are to movements in a selected benchmark.
Should I choose an equity fund with low standard deviation?
Not based on standard deviation alone. Compare the fund's returns, portfolio, downside risk, costs and investment objective with other funds in the same category before making a decision.