Sharpe Ratio in Mutual Funds: Sharpe vs Sortino Ratio Explained
By Amrita Sinha
About the Author
Amrita Sinha is a content strategist with experience in SEO, digital marketing, and financial content. She writes easy-to-understand, research-backed articles on investing, personal finance, taxation, and wealth management for Kuberzo.
Understand the Sharpe ratio in mutual funds, what the Sortino ratio measures, how to calculate both, and how to compare risk-adjusted returns.
Two mutual funds can deliver similar returns but expose investors to very different levels of risk. One fund may experience sharp ups and downs, while another may generate relatively steady returns. So, how do you compare their performance beyond the headline numbers?
This is where risk-adjusted return metrics become useful. The Sharpe ratio and Sortino ratio help investors evaluate how effectively a mutual fund has generated returns relative to the risk it has taken.
Understanding the Sharpe ratio in mutual funds can help you look beyond absolute returns when comparing schemes. The Sortino ratio takes a slightly different approach by focusing on downside risk rather than total volatility.
In this guide, we explain both ratios, their formulas, their differences, and how investors can use them when evaluating mutual funds.
What Is the Sharpe Ratio in Mutual Funds?
The Sharpe ratio measures how much excess return a mutual fund has generated for each unit of total volatility. It compares the fund's return with a risk-free rate and adjusts the difference for the fund's overall price fluctuations.
In simple terms, it helps answer this question: How much additional return did the fund generate for the level of risk it experienced?
A higher Sharpe ratio generally indicates better historical risk-adjusted performance, assuming the funds being compared use the same calculation method and period.
For example, consider two mutual funds that delivered similar returns over a particular period. If Fund A experienced significantly higher volatility than Fund B, Fund B may have a higher Sharpe ratio. This suggests that Fund B generated its returns with less overall fluctuation.
However, the Sharpe ratio is not a guarantee of future performance. It is a historical measure, and its usefulness depends on the period analysed, the risk-free rate used and the consistency of the underlying data.
How to Calculate the Sharpe Ratio
The Sharpe ratio formula is:
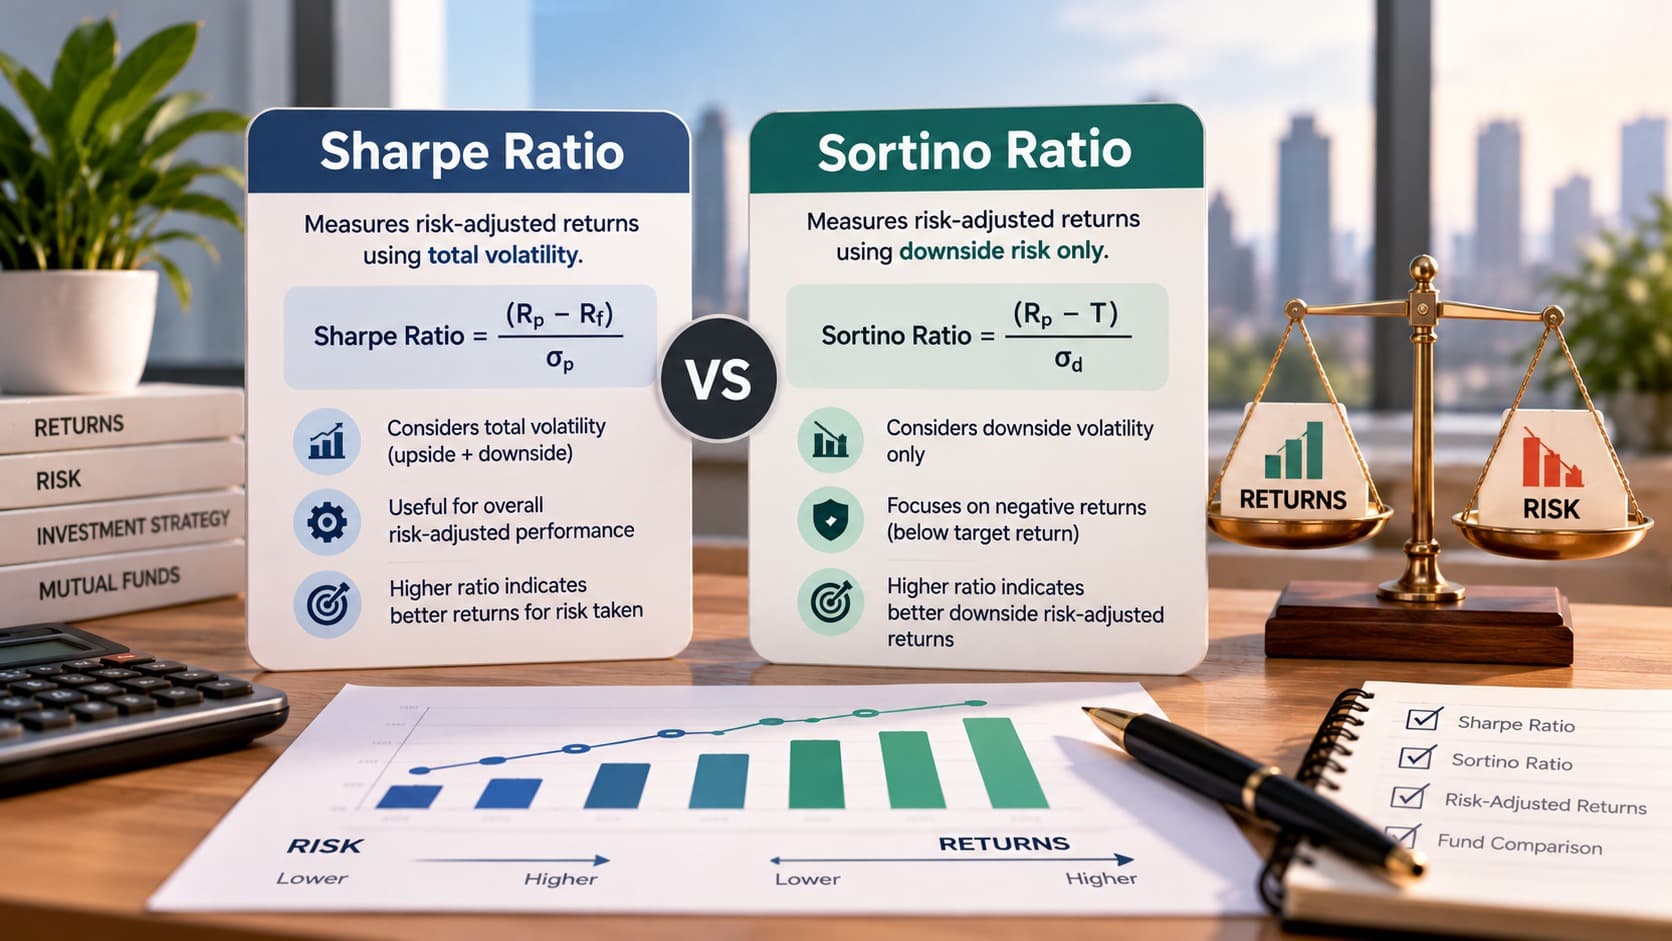
Sharpe Ratio = (Fund Return − Risk-Free Rate) ÷ Standard Deviation of Fund Returns
Here is what each component means:
Fund return: The return generated by the mutual fund over the selected period.
Risk-free rate: A reference return used to represent a low-risk investment, often based on a government security.
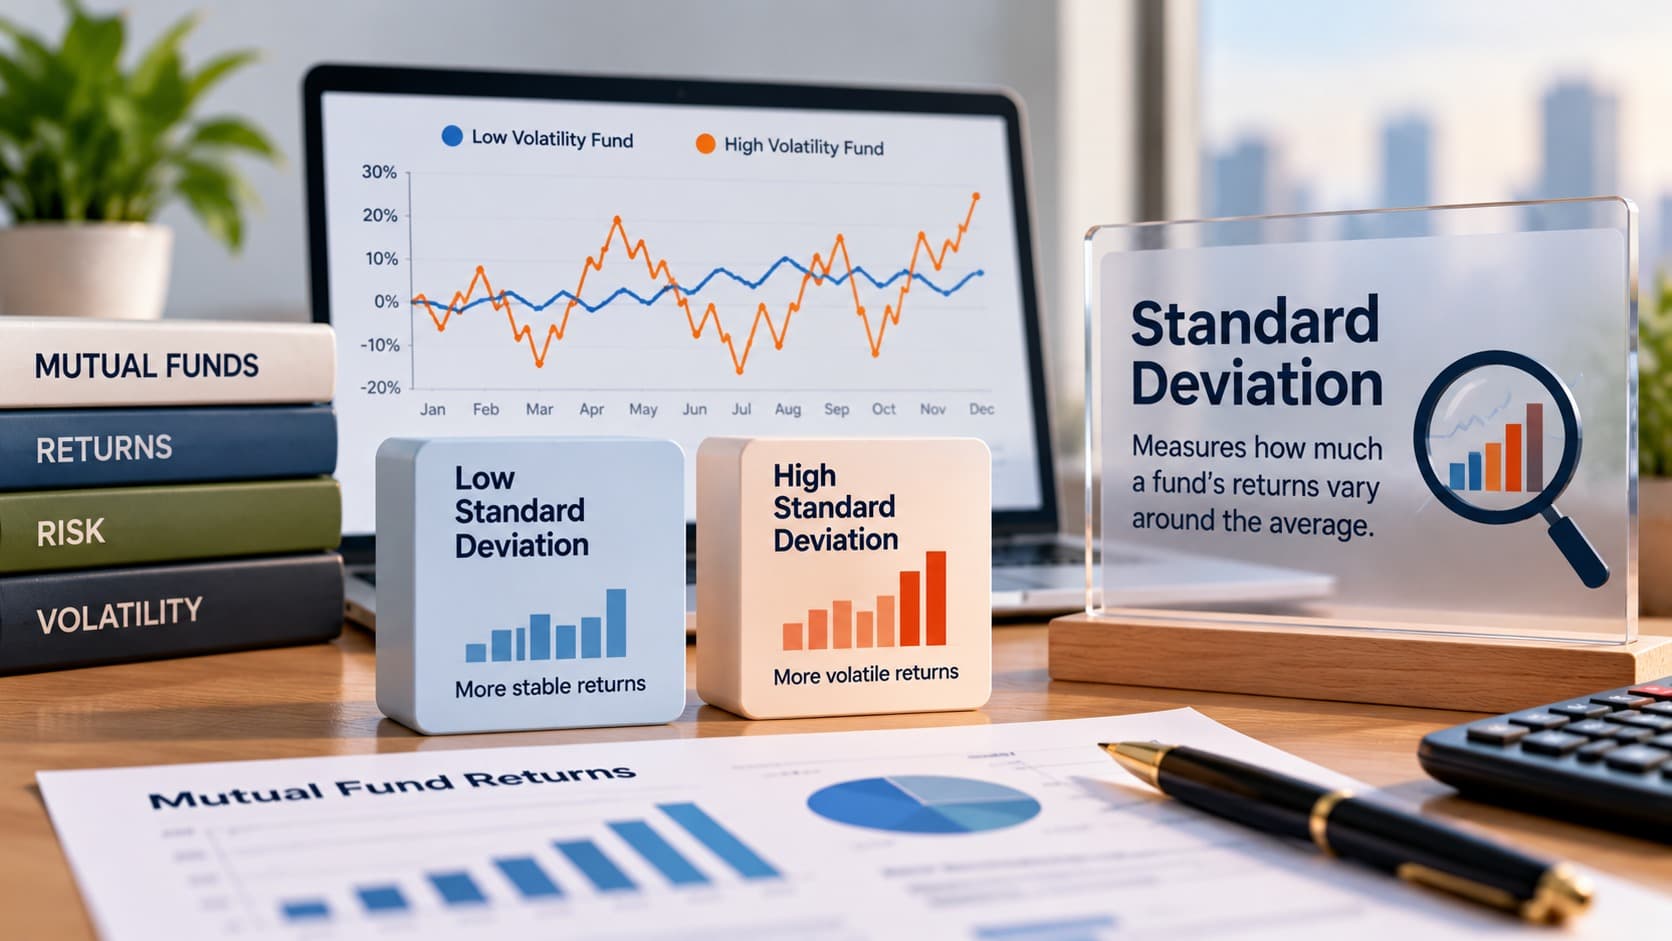
Standard deviation: A measure of how much the fund's returns fluctuate around their average.
For example, suppose a mutual fund generates an annualised return of 14%, the assumed risk-free rate is 6%, and the fund's annualised standard deviation is 8%.
The Sharpe ratio would be:
(14% − 6%) ÷ 8% = 1.0
This means the fund generated one unit of excess return for every unit of measured volatility under these assumptions.
The example is illustrative. Actual calculations can differ depending on whether monthly or daily returns are used, the period selected, and the methodology used by the data provider.
What Is Sortino Ratio?
The Sortino ratio is another risk-adjusted performance measure. Like the Sharpe ratio, it evaluates returns relative to risk, but it focuses on downside volatility rather than total volatility.
So, what is Sortino ratio in practical terms? It measures how much excess return a fund generated relative to the fluctuations in returns that fall below a specified target or minimum acceptable return.
The key distinction is that investors often view upward price movements differently from downward movements. The Sharpe ratio treats both as part of total volatility, while the Sortino ratio concentrates on downside deviations.
The Sortino ratio formula is:
Sortino Ratio = (Fund Return − Target Return) ÷ Downside Deviation
The target return may be a risk-free rate or another defined minimum acceptable return. Downside deviation measures the extent to which returns fall below that target.
For example, two funds may experience similar overall volatility, but one may have more frequent or deeper negative returns. The Sortino ratio can help distinguish their downside-risk profiles.
Sharpe vs Sortino Ratio: What Is the Difference?
The main difference in the Sharpe vs Sortino ratio comparison is how each metric measures risk.
Feature | Sharpe Ratio | Sortino Ratio |
Risk Measured | Total Volatility | Downside deviation |
Considers positive Volatility | Yes | No, not in the downside-risk denominator |
Focus | Excess return relative to total risk | Excess return relative to downside risk |
Useful for | Broad risk-adjusted performance comparisons | Understanding downside-risk efficiency |
Key limitation | Can penalise strong upward fluctuations | Can look unusually high when downside observations are limited |
Neither measure is universally better. The Sharpe ratio provides a broader view of volatility, while the Sortino ratio offers a more targeted view of downside fluctuations.
Using both can give investors a more complete picture of how a mutual fund has behaved.
Downside Deviation and the Sortino Ratio
Downside deviation Sortino ratio analysis focus on returns that fall below a selected target, rather than treating every fluctuation as equally undesirable.
Suppose a fund records the following monthly returns: 4%, −3%, 2%, −5% and 3%. A conventional volatility measure considers all these movements. Downside deviation, by contrast, focuses on the returns that fall below the chosen target.
The result depends on the target return, the observation period and the calculation method. This is why two platforms may report different Sortino ratios for the same fund.
The Sortino ratio is especially useful when investors want to understand how a fund has behaved during unfavourable periods. However, it should not be treated as a complete measure of capital protection. It does not replace analysis of maximum drawdown, portfolio holdings, credit risk, liquidity or other relevant risks.
What Is a Good Sharpe Ratio for Equity Funds?
There is no universal threshold that makes a Sharpe ratio good for every equity mutual fund. As a broad rule of thumb, a ratio above 1 is often viewed favourably, but the interpretation depends on the category, market environment, time period and calculation method.
When assessing a good Sharpe ratio for equity funds, consider these points:
Above 1: Often indicates a relatively favourable relationship between excess return and volatility.
Between 0 and 1: Indicates positive excess return, but the return relative to measured volatility may be less compelling.
Below 0: Indicates that the fund's return was below the assumed risk-free rate over the selected period, subject to the calculation methodology.
These are general guidelines, not fixed rules for selecting a fund. A high ratio over a short period may not remain high across different market conditions. Similarly, a fund with a lower ratio may have a different investment objective or risk profile.
Always compare funds within the same category and over the same period, using consistent data and calculation methods.
How to Use Sharpe Ratio to Pick Funds
Knowing how to use Sharpe ratio to pick funds can improve your analysis, but it should be one part of a broader evaluation. Before comparing funds, assess your investment risk profile to understand the level of market volatility you may be comfortable with.
1. Compare funds within the same category
Compare large-cap funds with other large-cap funds, or small-cap funds with other small-cap funds. Different categories have different return expectations and risk profiles, so direct comparisons across categories can be misleading.
2. Review returns alongside risk
A high Sharpe ratio is not enough on its own. Look at the fund's absolute returns, consistency and performance over multiple periods. A ratio should add context to the returns, not replace them.
3. Use the Sortino ratio for downside-risk context
When you want to understand how a fund has behaved below a target return, compare its Sortino ratio as well. This can be particularly helpful when two funds have similar Sharpe ratios but different patterns of negative returns.
4. Check other mutual fund risk metrics
The Sharpe and Sortino ratios do not capture every type of risk. Consider other mutual fund risk metrics, such as standard deviation, maximum drawdown, beta and portfolio concentration, where relevant.
5. Check the time period and methodology
Make sure the ratios use comparable periods and consistent assumptions. A three-year figure from one provider may not be directly comparable with a one-year figure calculated using a different risk-free rate or frequency of returns.
Common Limitations of Sharpe and Sortino Ratios
Both ratios are useful, but they have limitations.
First, they are backwards-looking. A fund's past risk-adjusted performance may not continue in the future.
Second, the results depend on the data and calculation method. Differences in observation frequency, the risk-free rate, the target return and the evaluation period can change the reported ratios.
Third, the ratios do not explain why a fund performed the way it did. A strong ratio does not automatically mean the fund has a sound investment process, a suitable portfolio or low risk in every market environment.
Finally, a single metric cannot replace your investment objectives and risk tolerance. A fund that scores well on a risk-adjusted basis may still be unsuitable if it does not match your time horizon or financial needs.
A regular mutual fund portfolio review can help you examine portfolio exposure, investment concentration and risk beyond a single performance metric.
Conclusion
The Sharpe ratio and Sortino ratio help investors evaluate mutual fund returns in relation to risk. The Sharpe ratio considers total volatility, while the Sortino ratio focuses on downside deviation.
Used together, they can provide useful context when comparing funds. However, neither ratio guarantees future returns or independently identifies the best mutual fund.
For a more balanced decision, compare funds within the same category, review performance across different periods, understand portfolio risks and examine other relevant metrics. Most importantly, choose investments that fit your financial goals, time horizon and ability to handle market fluctuations.
A goal-based financial planner can help you evaluate fund choices in the context of your time horizon, financial goals and risk tolerance.
Frequently Asked Questions
What is the Sharpe ratio in mutual funds?
The Sharpe ratio measures the excess return a mutual fund generates over a risk-free rate for each unit of total volatility. A higher ratio generally indicates better historical risk-adjusted performance when comparisons are made consistently.
What is the difference between Sharpe and Sortino ratios?
The Sharpe ratio uses total volatility, including upward and downward fluctuations. The Sortino ratio uses downside deviation, focusing on returns below a specified target.
What is a good Sharpe ratio for equity funds?
A Sharpe ratio above 1 is often considered favourable as a broad guideline. However, there is no universal threshold. Compare funds within the same category, over the same period and using consistent calculation methods.
Can the Sortino ratio be higher than the Sharpe ratio?
Yes. Since the Sortino ratio focuses on downside deviation rather than total volatility, it can be higher than the Sharpe ratio. The result depends on the fund's return pattern, target return and calculation method.